Exploring large codebase (unity build) compilation time
Intro
Previously I wrote a post about compiling inkscape’s codebase using “unity build” methods where all files that need to be compiled are joined during preprosessing phase and then compiled as single compilation unit. Compiling all that code in one go took from 3 to 6 minutes depending on optimization parameters. I got some free time and want to explore where time could be spent.
In the previous post there were several compilation units (instead of just one). This was done becase there was main compilation unit related to inkscape and others were external libraries. Since I don’t assume external libraries will be changing during development I decided to give them their own space. In this post I will be looking only into main compilation unit because it is unit that takes most of the time. All other comilation units in total take roughly 10 seconds while main one takes several minutes so it logical to spend time looking into the most “problematic” place.
Currently time distribution for compilation (on my current computer) looks like this.
Copy data files: .185105678 seconds
Compile lib2geom.so: 17.437606971 seconds
Compile liblivarot_LIB.a: 6.259619460 seconds
Compile libutil_LIB.a: 7.790196950 seconds
Compile libuemf_LIB.a: 1.071249511 seconds
Compile libcroco_LIB.a: .678505152 seconds
Compile libdepixelize_LIB.a: 2.989161327 seconds
Compile libavoid_LIB.a: 10.573620461 seconds
Compile libcola_LIB.a: 1.921713723 seconds
Compile libvpsc_LIB.a: .964423906 seconds
Compile libautotrace_LIB.a: .294723941 seconds
Compile libgc_LIB.a: .537479040 seconds
Compile inkscape binary: 385.648089621 seconds
We will be looking only at inkscape final compilation unit.
First of all let’s look at raw source code numbers. I ran “cloc *” in a project root directory and got these numbers:
------------------------------------------------------------------------
Language                        code     blank        comment     files
------------------------------------------------------------------------
PO File                      2557321   1042936        1523404        88
SVG                           471582      3022           1822      3606
C++                           464864     85253          91898      1407
C/C++ Header                   96830     27853          54205      1308
Python                         61830     13612          16414       532
C                              52514      9493          17897        80
make                           36992     13415          10271        99
Text                           29221      8452              0       238
CMake                          24270      3626           3778       774
Gencat NLS                     21614       286              0        64
XML                            16051      1174            993       246
CSS                            14890      2846           1502        46
Glade                          13834        24             62        41
XML (Qt/GTK)                   11630         0              4        34
Cython                          4729      1726           1532        15
JavaScript                      3855       745            797         7
XSLT                            3540       351            638        11
reStructuredText                2070       977            696        24
YAML                            2067       128             76        10
Bourne Shell                    1453       324            336        39
Markdown                        1365       498              8        35
CSV                             1116         0              0         3
TypeScript                       692         0              0       346
HTML                             658        45             18         6
Perl                             618       160            162         4
TeX                              586       194              9         2
m4                               380        68             62         2
Visual Studio Solution           289         3              3         3
MSBuild script                   288         6             32         2
Bourne Again Shell               221        64             48         3
diff                             209        26            121         2
TOML                              83         7              7         3
DOS Batch                         72        18              2         6
INI                               66        16              0         3
Expect                            56        18              0         1
Tcl/Tk                            52        22             32         1
WiX source                        34         8              0         1
Windows Module Definition         29         1              5         2
Windows Resource File             29         1              0         1
JSON                              20         0              0         1
XAML                               2         0              0         1
------------------------------------------------------------------------
SUM:                         3898022   1217398        1726834      9097
So we have 464K lines of C++ code, 96K line headers and 52K likes of C code. These are totals and includes code for external libraries. I will try to remove extra lines and get actual lines of code for the main compilation unit.
Aside: Why do they have 36K lines of makefiles and 24k lines of CMake files?
For unity build I created single all.cpp file that included all needed files into it. Instead of compiling it we can use “-E” flag to just preprocess it and actually combine all included files into one. For this I used this command:
c++ -E $CFLAGS_MAIN \
    $SRC/all.cpp \
    -o all_preprocessed.cc \
    $LDFLAGS
This produces one 37MB file. Looking at raw file gives us 1_031_397 lines of “code”. Since it is preprocessed result it contains a bunch preproccer lines indicating files and location. Removing all those lines (starting with “# “) reduces size to 976K lines. Running “cloc all_preprocessed.cc” gives us 695K lines of code.
If we assume that we hvae 695K lines of code compiled in 385 then we get 1800 lines/second compilation speed. This is roughly similar to what we got in the last article.
Syscalls
Hoping to get some low hanging fruits I tried to look into syscalls. For this I used the same command with some extra params for strace.
strace -T -t -f -o strace_out.txt \
    c++ $CFLAGS_MAIN \
        $SRC/all.cpp \
        -o inkscape \
        $LDFLAGS
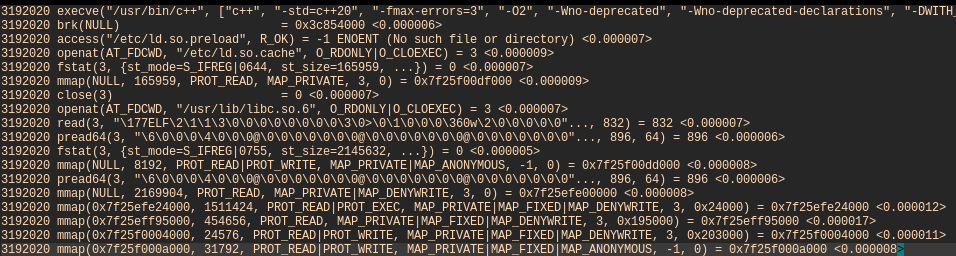
First of all we are interested to look into all “subprocesses” and used “-f” for that. This will show starting process with all process that it will start (if any). -T and -t are used to show real time and individual timing per syscall. Then dump everything to a file for later processing.
As a result this creates a file with about 850K syscall spread over 375 seconds. Looking over those lines does not give any additional insight as there are no apparent outliers. I wrote a small program to extract and explore some basic stats from this file. First of all “c++” executable start another 4 processes during execution. Here are process ids with how many syscalls they called.
'3192020': 227,
'3192021': 330440,
'3192780': 70127,
'3192791': 218,
'3192792': 447009
Next is to look into syscall themselves. Here is the list:
command         |   amount | total time
----------------------------------------------------
execve          |       13 |   0.000799
brk             |     9569 |   0.047949
access          |       62 |   0.000310
openat          |   155016 |   0.488216
fstat           |    22577 |   0.056053
mmap            |    13981 |   0.192727
close           |     8337 |   0.021549
read            |   203240 |   0.604515
pread64         |       10 |   0.000037
arch_prctl      |        5 |   0.000021
set_tid_address |        5 |   0.000018
set_robust_list |        5 |   0.000016
rseq            |        5 |   0.000018
mprotect        |       33 |   0.000234
prlimit64       |       14 |   0.000066
getrandom       |        8 |   0.000034
munmap          |      368 |   0.011382
futex           |        5 |   0.000020
ioctl           |       26 |   0.000103
rt_sigaction    |       36 |   0.000131
newfstatat      |      349 |   0.001744
readlink        |    97439 |   0.281958
getcwd          |      103 |   0.000269
rt_sigprocmask  |       24 |   0.000088
clone3          |        4 |   0.000729
sysinfo         |        3 |   0.000019
faccessat2      |     5671 |   0.017385
madvise         |       36 |   0.000478
mremap          |        9 |   0.000310
write           |    93497 |   0.614183
wait4           |        5 | 416.315802
exit_group      |        5 |   0.000000
getrusage       |       82 |   0.000246
fcntl           |      498 |   0.001223
lseek           |   236963 |   0.526468
dup             |       11 |   0.000025
getdents64      |        4 |   0.000020
umask           |        2 |   0.000005
chmod           |        1 |   0.000006
unlink          |        5 |   0.010854
Looking at this table we clearly see that there are no obvious offenders. Even though we do a lot of syscalls they don’t take a lot of time. From the table the biggest time user looks like wait4 syscall. But it just waits for another process.
Some notable syscalls:
readlink(…): There were 97439 calls of readline. 86596 of this were EINVAL and rest is ENOENT. So all calls to readlink resulted in error.
read(…): There 203240 calls to read. If we sum up all read amounts we get 1GB (1019936061 bytes) read in total. Largest read was 3.8MB (3865472 bytes). Actually there were 10 reads more than 1 MB and the rest were smaller reads. The big 3MB read was a /tmp/ccU1fgMR.o file.
write: There were 93497 write calls. In total it wrote 231 MB (231457895 bytes). With largest write being 9.5 MB (9_506_816 bytes). This write was for ‘inkscape’ binary itself.
execve: it shows 13 calls but in reality it was 5 calls. Othere were ENOENT. So we can see that we started with c++ and it the called other 4.
1) /usr/bin/c++
2) /usr/lib/gcc/x86_64-pc-linux-gnu/15.2.1/cc1plus
3) /usr/bin/as
4) /usr/lib/gcc/x86_64-pc-linux-gnu/15.2.1/collect2
5) /usr/bin/ld
openat: The program tried opening 155016 files of those 146635 were ENOENT and only 8381 were successfull. From these opened files there were a lot of duplicates. Removing dublicates leaves us with 5967 uniqe file paths. I removed not related files and that left us with these:
 3423 .h
 1275 .hpp
  875 .cpp
  195 .so
   32 .tcc
   22 .ipp
   13 .a
    8 .conf
    ...
I tried cating togetter all h, hpp, cpp, tcc, ipp files and resulting file was 54MB with about 1.5 million raw lines of code. This is significantly larger that the file I calculated using “gcc -E”. But in this case I decided not to spend more time on this for now.
We can see that there were quite a few header files. These are probably boost and other headers from standart library.
unlink: Since in the end it removes just 4 files I assume it created only 5 temporary files during process of compilation. The files were: /tmp/ccJ8g4Os.cdtor.c, /tmp/ccNQCMUo.cdtor.o, /tmp/cc7K6Det.res, /tmp/ccU1fgMR.o, /tmp/cckTy2lE.s.
wait4: it is syscall to wait for pid and in here it uses most of the time. In reality it does not take time. It just starts waiting and counts times from start to the time when when child returns. Here are timing for this run:
3192020 <... wait4 resumed>, ...           <313.367923>
3192020 <... wait4 resumed>, ... = 3192021 <82.373998>
3192020 <... wait4 resumed>, ... = 3192780 <11.422819>
3192791 <... wait4 resumed>, ... = 3192792 <4.574100>
3192020 <... wait4 resumed>, ... = 3192791 <4.576962>
Clearly the biggest time block is first wait4. Looking into process start list it it is cc1plus. So the most of the time is spent actually reading files processing them and creating assembly code from it.
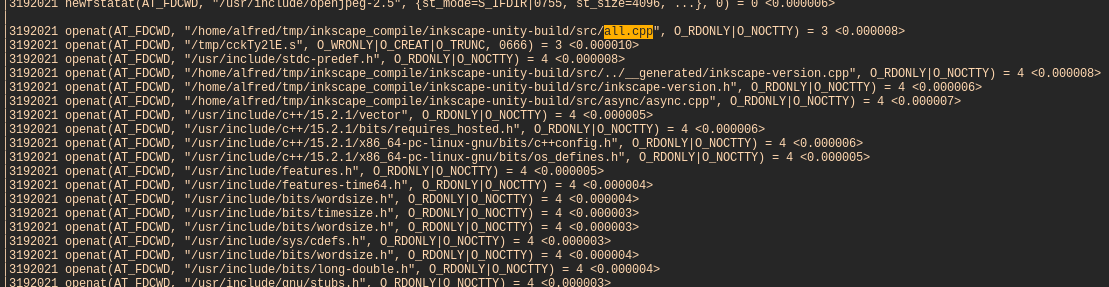
We can see that it start with “all.cpp” catch all file. After that it opens a temporary file where it will be writing create output. It is in this process that it will open 7941 files. Here we see that it start with “all.cpp” and ends with “inkscape-main.cpp” file.
This whole process of opening all this almost 8k files and reading them took slightly over 4 seconds.
Next part is about 2 minutes and filled with 14K syscalls of brk and mmap. It looks like it read all needed files and then started processing. During the processing it allocated a lot of small blocks of memory. At the start of processing of this block it used 3-9 microseconds per syscall. At the end of this block the same syscall time grow to 60-90 microseconds. Since we it is memory calls I can assume we might be stressing memory to find blocks of available memory.
Next block of actions is writing. It is 36k syscalls to write. Each write is 4096 or one page (buffering?) and it is all writing and assembly output (135 MB). This whole block of writing take 4 and a half minutes. Writing 135 MB should not take 4+ minutes (which makes it barely 0.5MB/s). I have a fast SSD. So this means that most of the time is spent either converting AST to assembly or even more compilation in between. After writing it closes assembly file and closed process.
So we can say that roughly speaking this process of compilation took 4 seconds to load all files (with probably minor processing), about 2 minutes of aggresive small memory allocations (probably parsing and compiling into AST) and then 4 minutes converting AST to assembly and writing it to disk.
Template processing
At the beginning when we created a single preporcessed file I counted all template definitions: “template<”. It was 14588 different definitions. My next assumption was too look at code size exploding due to templates. But how do we look at it? Preprocessor does not expand tempates. To check it I had to switch from GCC to clang and use cppinsights.
cppinsights is a plugin to clang that can convert ast back to code and print it out. Unfortunately my experiments with direct “insights” binary didn’t work out as it was crashing clang. I decided to try do it directly though clang command using these options:
clang++ -Xclang -ast-print -fsyntax-only \
    $CFLAGS_MAIN \
    $SRC/all.cpp \
    $LDFLAGS \
    > out.cc
So it is pretty much the same compilatio but now we use clang and instead of creating binary we dump out code. The resulting out.cc is 700 MB file of raw C++ code (Remember that our initial assumption was about 35-40 MB). So it is 20x increase in raw byte size. Counting lines using “cloc out.cc” tells us that this file is 5 million lines of code (5037380 to be precise). At least 7x increase in size.
So previous 2 minute processing for file was probably expanding templates and size code before starting compilation. And if our calculation was correct then the speed is not 1800 lines per second but full 12000 lines per second (5mil / 386 seconds).
Conclusion
This is rought draft of (back of the envelope) exploring what was happening during unity build of inkscape code and why it (might have) took this much time to compile. The file expands from 30-40 MB source code to 700+ MB source code. And source lines expand from 700k to 5m.
All this process of expanding and the compiling this massive amoutn of code takes some time.
This is all guesstimates and proper analysis would take actual clang/gcc code and profile using those. This is rough exploration and maybe will be expanded to more pricise methods.