Is server slow? Estimating server endpoint processing time from client perspective
Intro
Sometimes when I work on some mobile apps I get an issue of having slow response times which in turn make the app “work slow” and all complaints come to me. For an app user or business owner it does not matter who is responsible. The app works slow so for them “whoever developed the app did a bad job”. Sometimes it is easy to solve by just talking to backend guys, making proper measurements on the backend and after verifying the issue just let them do their backend magic. Other times it is a lot more harder because either backend guys don’t want to spend time looking into it, they are beginners and don’t know how and where to look or just begin malicious. I had all of these issues and everytime had to prove my point to start moving conversation in the right direction. It could also be that we messed up or the network is/was bad. So first of all we need to verify that it is not us and the network is fine.
So what do we look for? I usually look into these 5 areas.
- (1) DNS
- (2) Initial Connection
- (3) TLS setup
- (4) Server processing
- (5) Download contents
Ideal for our use case is the number 4. In this case we assume that it is the server that takes a lot of time to process request and thus pass it to the backend guys. What are the others?
First of all is DNS. I have never had issues with DNS slowing anything down. Even if it is slow it will be slow just for one request and then just be cached. But it is very often the case that it is the reason when request do not work completely.
After DNS step the app has IP address and ready to create initial connection. This is step (2). For me this is a good indicatin if there is network (sometimes server) overload. This is where initial TCP handshake will happen and mostly should happen pretty quickly. If the network is unreliable or overloaded then we will either have high roundtrip times.
TLS setup setup starts right after TCP handshake it is usually in the range of 2KB to 8KB and should not take much time. I had issues with this when users where behind corporate or other firewalls which tried to pick into and process TLS packets. During peak times the firewall couldn’t handle all the requests and thus delayed start of the communication.
Then there is Content download. This happens after server got request, processed it, got all data from the database, prepared a response and sent it back. This is second place to look for network issues after looking at connection setup. Time spent in this step is from delivering first byte up until the very last delivered byte.
So after all these are within acceptable margin we can look into how much time does Server processing takes. But where do we find that information? We can estimate it as the time between sending a request and getting the first byte (TTFB). So after we got IP address, created connection and exchanged TLS keys the client will send a request. It will take RTT/2 time and the rest of the time is server processing and preparing response with another RTT/2 time for delivering first byte. If network is “good enough” then this RTT could be ignored and we can assume that this whole time was used to process requests. Of course if server processing time is 10ms and RTT is 500ms then this calculation is wrong. But we are talking about good networks and problematic servers. In my case it usually was a few seconds TTFB with small RTT times. We are not trying exactly calculate request processing time but rather trying to find cases which we can safely assume that issue is with slow server processing.
Chrome / Firefox / etc
The simplest thing is too just use developer tools from chrome, firefox or any other browsers. Here is an example of looking at google main page from chromium.
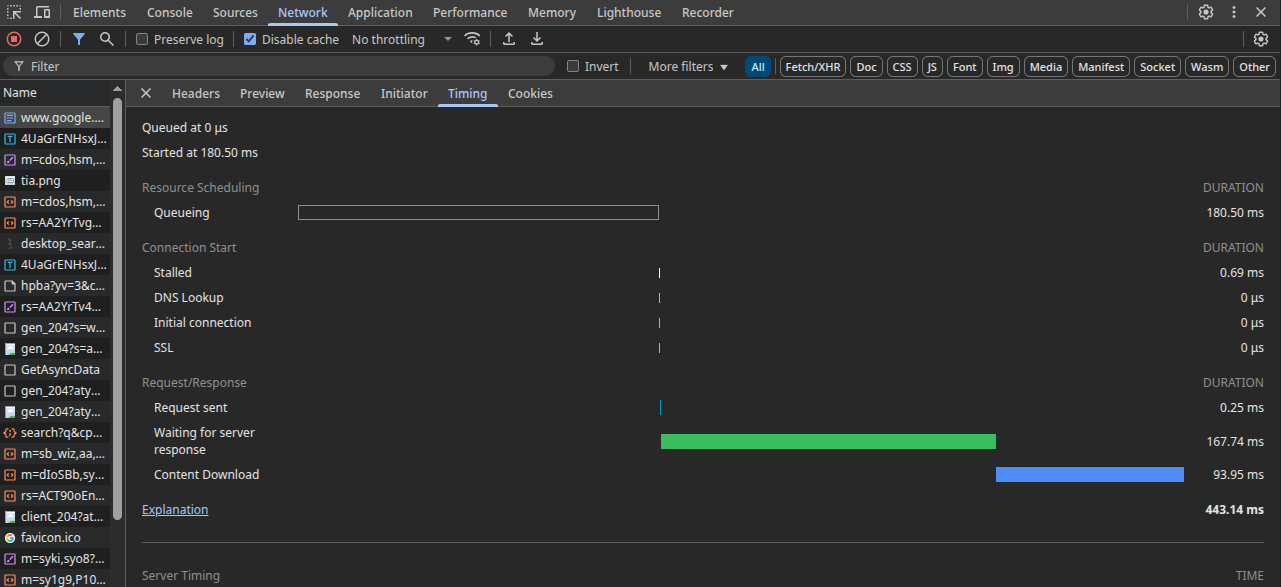
This might seem good enough for simple and quick test but during my tests it was a bit hard to use. For example why the initial connection and TLS setup was 0? Is it reusing older connections or is there something else in the play? Also since I was mostly testing API endpoints (website was fine and API seemed slow) I had to send extra information in the header, requests needed to be sending some dynamic information and be able to different and quick experiments with ability to log a a lot of different requests. This made browser tools a bit unreliable for my use case.
Using Curl
It seems like the next to best solution after using development tools from a browser is to use a plugin that will add missing parts. But since I wanted to more control over execution and I already used curl pretty heavily it natural next solution for me.
For this we can curl’s option of showing extra information -w, --write-out <format>
part is quite big and has all sorts of meta information about the
connection. It can show how many TLS certificates there were, how many headers,
what was the IP or how many redirects. For our case we care only about meta
information related to request timing. To see how much time it took to connect
to the website we can use request similar to this:
curl https://www.google.com -w "\n\nConnect:%{time_connect}\n"
This will output whole response with additional line showing how much time it took to connect to the website. To make it more useful for our task we would need to use something like this:
curl -o /dev/null -s -w \
"\n--------------------------------------------------
   namelookup : %{time_namelookup}\n\
      connect : %{time_connect}\n\
   appconnect : %{time_appconnect}\n\
  pretransfer : %{time_pretransfer}\n\
starttransfer : %{time_starttransfer}\n\
     redirect : %{time_redirect}s\n
--------\n\
          size: %{size_download}\n\
         total: %{time_total}\n" \
https://www.google.com
with the output that might look something like this:
--------------------------------------------------
   namelookup : 0.003658
      connect : 0.095526
   appconnect : 0.198420
  pretransfer : 0.198568
starttransfer : 0.320381
     redirect : 0.000000s

--------
          size: 17632
         total: 0.343240
Here is description of params man pages:
- time_namelookup: The time, in seconds, it took from the start until the name resolving was completed.
- time_connect: The time, in seconds, it took from the start until the TCP connect to the remote host (or proxy) was completed.
- time_appconnect: The time, in seconds, it took from the start until the SSL/SSH/etc connect/handshake to the remote host was completed.
- time_pretransfer: The time, in seconds, it took from the start until the file transfer was just about to begin. This includes all pre-transfer commands and negotiations that are specific to the particular protocol(s) involved.
- time_starttransfer: The time, in seconds, it took from the start until the first byte was received. This includes time_pretransfer and also the time the server needed to calculate the result.
- redirect: The time, in seconds, it took for all redirection steps including name lookup, connect, pretransfer and transfer before the final transaction was started. “time_redirect” shows the complete execution time for multiple redirections.
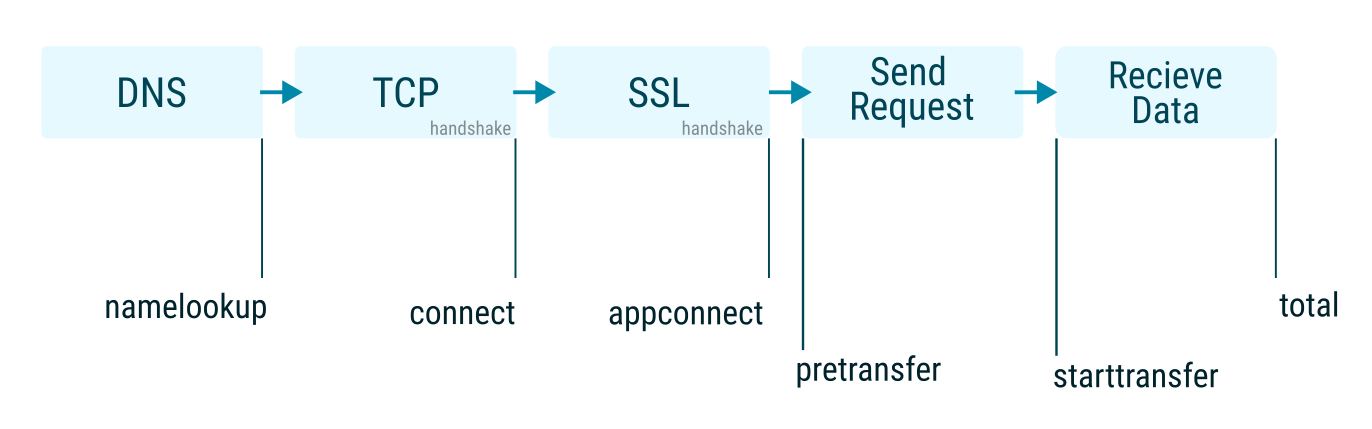
Namelookup is our DNS or how much time it took to resolve ip address before we are starting to connect. Connect is time time when connection to remote server has been established. redirect is not really important here as we are supposed to use final urls but I still have that just to as check which when not zero tells us that we messed up. pretransfer is when we did all setup and are about ready to send data. starttransfer is our TTFB or time when the the very first byte was received.
So to estimate server latency we can just pretransfer from starttransfer
or server_processing_estimate = starttransfer - pretransfer
We could write a bash script to do that calculation automatically but I didn’t do that because I could calculate rough estimate in my head and it was enough at the time. But what we could do is to use file configuration instead of passing those –write-out params each time. For this we can put the format into a file somewhere in the filesystem. For example create a file curl-format.txt:
\n--------------------------------------------------\n
   namelookup : %{time_namelookup}\n
      connect : %{time_connect}\n
   appconnect : %{time_appconnect}\n
  pretransfer : %{time_pretransfer}\n
starttransfer : %{time_starttransfer}\n
     redirect : %{time_redirect}\n
--------\n
          size: %{size_download}\n
         total: %{time_total}\n
and then we can call curl to test timings with
curl -o /dev/null -s -w @curl-format.txt
Since I used this a lot I just created an alias in bash
alias curltt=' curl -w "@/home/alfred/inbox/curl-format.txt" -o /dev/null -s '
and just call it with: “curltt https://www.google.com”
Next logical iteration is just to repeat the same request several times to get better understanding of how a request behaves over multiple samples. Getting one sample could be erroneous. Maybe network was bad at the time or just random variability. Looking into multiple repeating request solves this (well actually doing statistics is better but this version is good enough).
For me I used a curl library and wrote a simple program that runs the same request multiple times over the same connection. But we could have used script for it (but keeping connection could’ve been problematic). Here is example for requestion google and it’s ‘www’ final subdomain.
Using App
The app could be downloaded here: Network tools - netops
Curl is mostly fine for these types of explorations but recently I have been collecting and porting all my tiny utilities into one crossplatform app that I can be used on different platforms and expect to behave the same on all of them. Also it is useful to give to regular people instead of asking them to download and run some terminal apps. Also I get a lot more control and can experiment with data extraction and visualisation.
This is how this would look into single connection from the client:
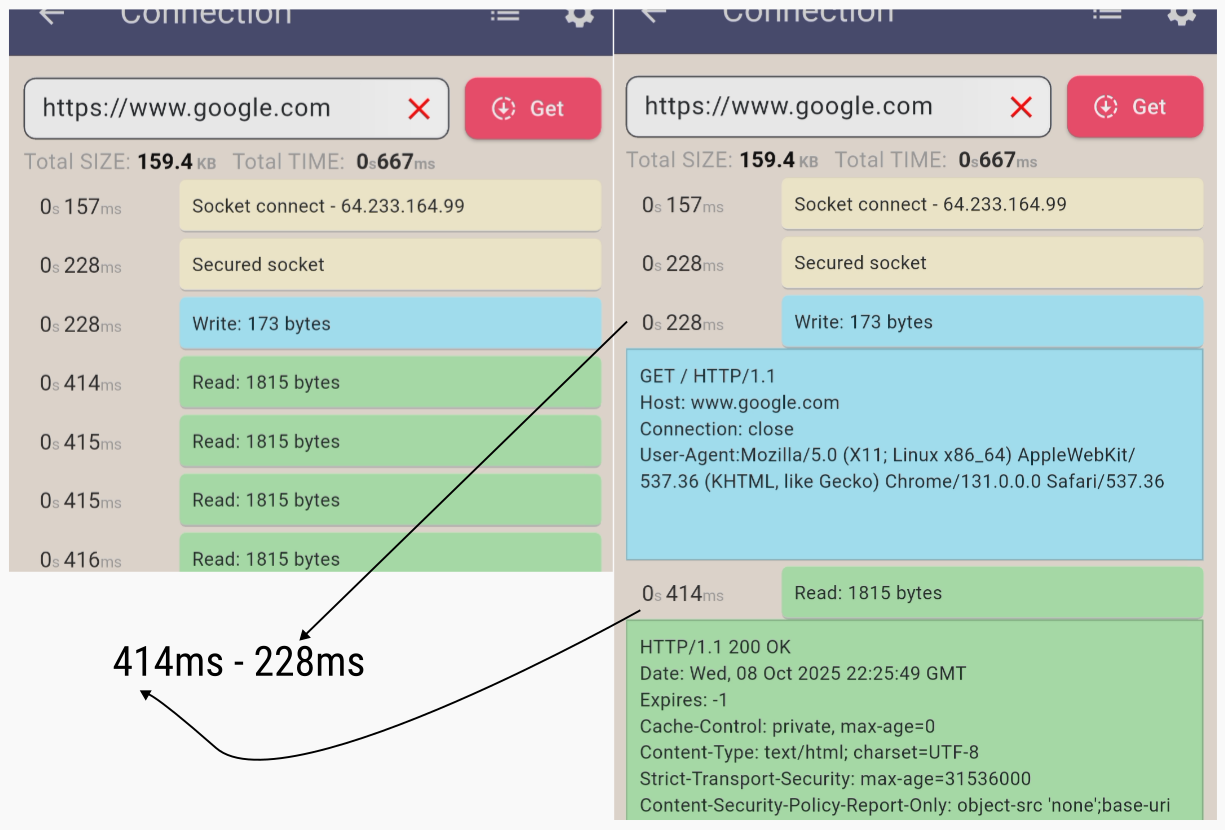
It provides pretty much all the same information. There is no DNS because I don’t really need it in my tests and it would have required some extra work to add to this screen. The timings are cumulative. So when it says that it 228ms for writing it means that it started writing 228ms after the test has started. 414ms - 228ms gives us 186ms between when we sent a request and the first byte came back. In this case of course it does not mean that google spent 228ms rendering HTML page. If we look at other parts and we see that the current network is very stable. It has a high ping and RTT. But it does not matter because even if it was true that page was being prepared for 200ms it is not the issue that I used to get. The complaints I get are when it takes more than second (in the last case that I had it was 8 seconds for an API endpoint).
But it is best not to look into individual connection but rather run several tests and look at aggregated statistics. In contrast to the curl version these do not run in the same connection but rather in a separate HTTP/1.1 connection. This is done because currently I have issues with testing networks and I want to see aggregated stats on connection,TLS etc.
Let’s now look at how it might look when we access the api endpoint but one is fast and second is before it was fixed. The stats is in short version and thus does not show when writing started. But here we can estimate time difference between secure connection establishment and first byte arriving as good enough approximation to server processing time.
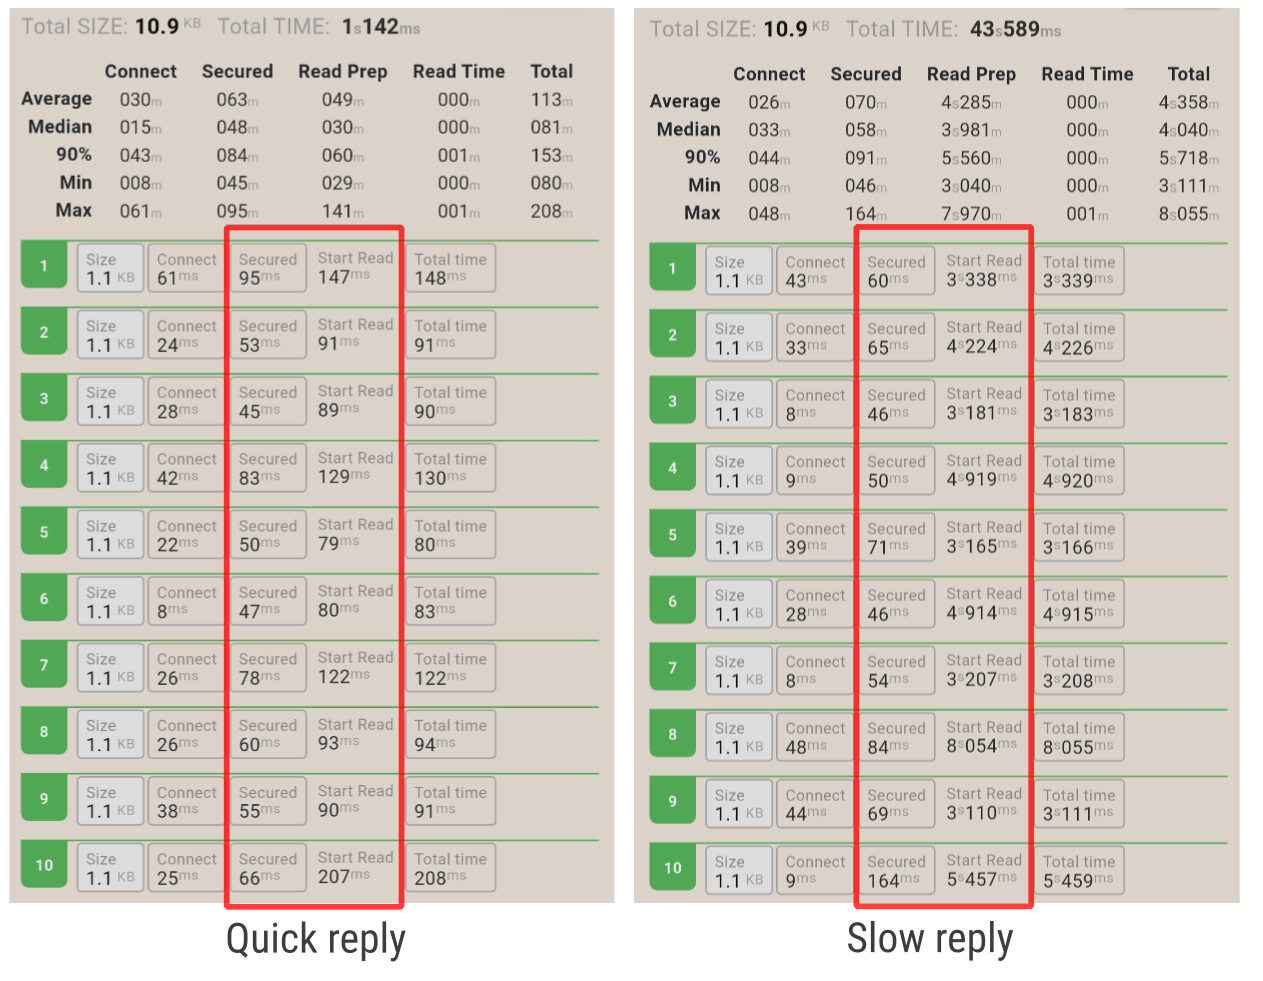
As we can see the network is not great but we can safely assume that processing is taking not more than 207 - 66 = 141 milliseconds. On the right screen it is clear taht network is fine since transfering content take just few milliseconds but time between securing connection and starting reading is several seconds at least.
But there is sometimes cases where our logic of counting difference between full connection setup and getting first byte is not working. It is when responses are streamed. It could be that nginx is sending initial response right away but is stuck waiting upstream to prepare response. For example let’s look at bellow example:
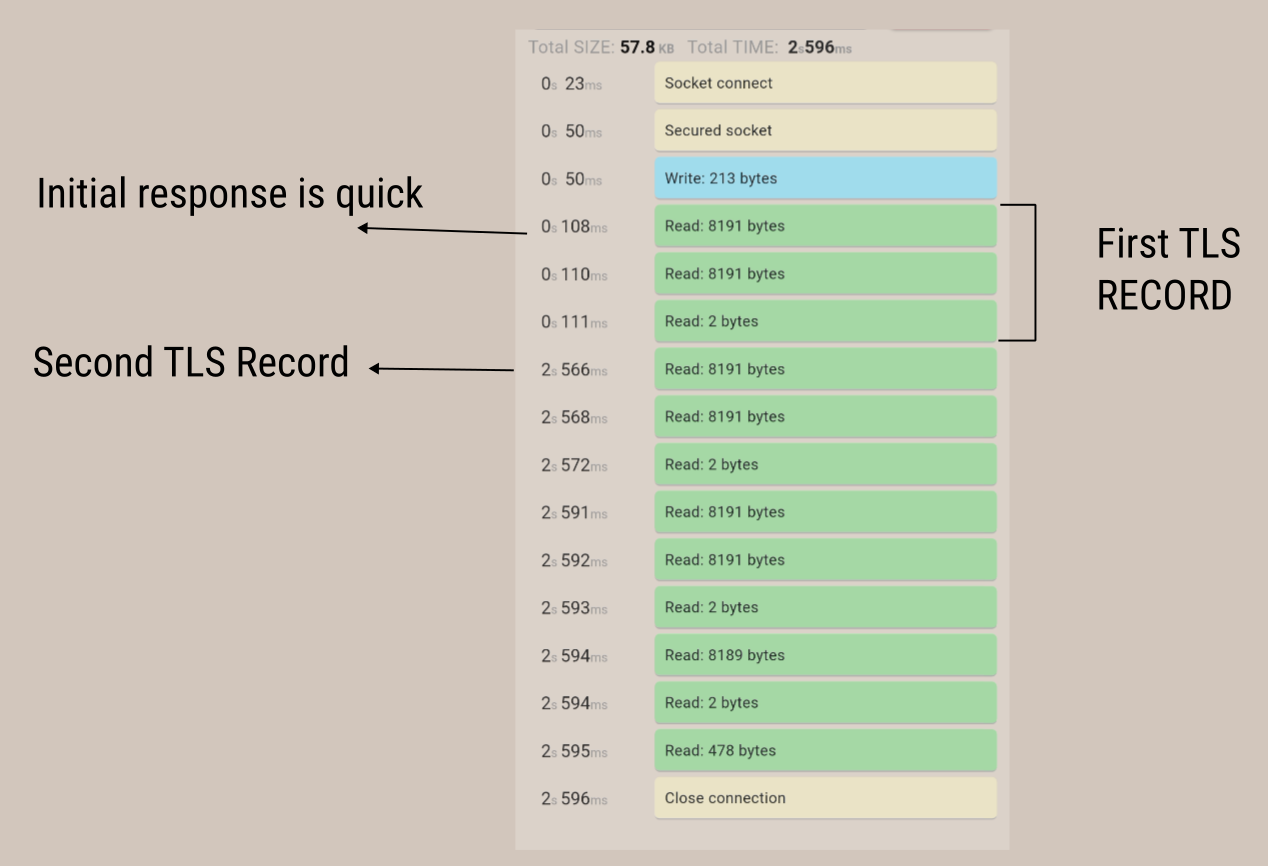
As we can see that network is fine. Initial response is quick. But there sharp delay after initial response. In this example responses split in weird 8k chunks but it due to dart’s decryption buffering split. In this example we can see that first 16KB are returned quickly (default TLS record size in nginx). Then it is probably waiting or buffering data from upstream which takes more than 2 seconds. In this example I used single connection exploring because looking at multiconnection testing statistics will give wrong imporession that results are returned quickly. But in reality we see that there is still issue with network response preparing times. When in doubt it is good to look at different angles.
Conclusion
The post was about approximating server processing time for the times when we need but do not have access to the backend or backend guys are busy/not_helpful/not_ready. To do that reliably we looked at different things that could affect document download time. Sometimes it is really just problem with the network and there is not much that we can do. But when the network is good and stable we can look at the times between writing of the request stared and return of the first response byte. If other metrics are stable and quick then we can assume that there is issue with server processing time at this endpoint and increase priority of fixing (or at least having a better look at) this endpoint.